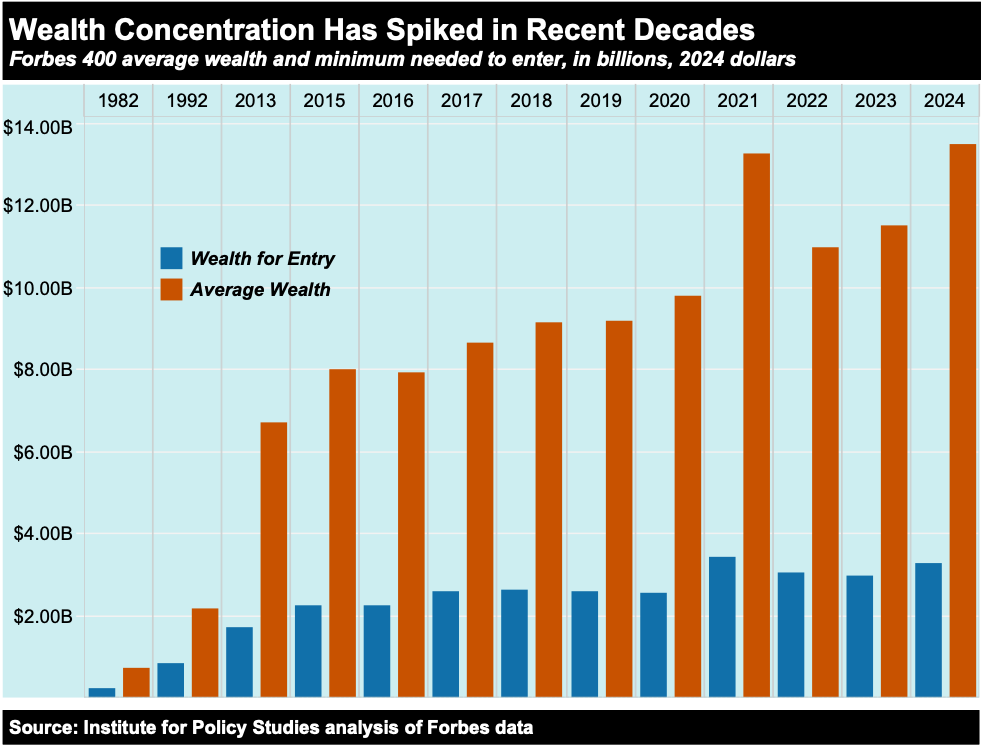
The United States has more wealth inequality than any other major developed nation
The Pew Research Center found that the wealth gap between America’s richest and poorer families more than doubled from 1989 to 2016.
In 1989, the richest 5% of families had 114 times as much wealth as families in the second quintile (one tier above the lowest), at the median $2.3 million compared with $20,300. By 2016, the top 5% held 248 times as much wealth at the median. (The median wealth of the poorest 20% is either zero or negative in most years we examined.)
This trend started before 1989. In 1963, the wealthiest families had 36 times the wealth of families in the middle of the wealth distribution. By 2022, they had 71 times the wealth of families in the middle. (https://apps.urban.org/features/wealth-inequality-charts/)
A recent article by CNBC reported that the top 10% of Americans added $5 trillion to their wealth in the second quarter. All wealth groups gained over the past year, but growth is fastest at the very top. “The top 1% have seen their wealth increase by $4 trillion over the past year, an increase of 7%. Their wealth hit a record $52 trillion in the second quarter…the top 0.1%, or those with a net worth of at least $46 million, have seen their total wealth nearly double to over $23 trillion” since the pandemic.
To give a clearer picture of what a million vs. a billion vs a trillion is, consider this.
A million seconds is equal to about 1.65 weeks.
A billion seconds is equal to about 31.7 years.
A trillion seconds is equal to about 31.7 THOUSAND years.
Too bad Elon won’t be around to spend it all.
Esther Kronenberg is an editor of and frequent contributor to Works in Progress

Be First to Comment